POWER BI · DATA ANALYTICS · PORTFOLIO PROJECT
CoderCleta
A data exploration turned into a dashboard for observing, comparing and asking better questions.

CONCEPT COVER · NOT THE ORIGINAL DASHBOARD
INTERACTIVE EXPLORATION · 2026 REBUILD
ECOBICI BUENOS AIRES · HISTORICAL MODEL 2015–2021
Recovered trips and stations.
The recovered Power BI export contains 2,866 trips from 2015 to 2021 and station dimensions. An independent age table has 281,458 records covering 2015–2020; these datasets cannot be joined row by row. Some fields are missing.
Loading sample…
05 · DEMOGRAPHICS
Age distribution
Fact_edad summary (2015–2020): separate dataset. Only the year filter applies, not gender or station.
0 age rows for selected year or period
Source: coder2.xlsx, exported from Power BI Desktop. Fact (2,866 rows), station dimensions, and independent Fact_edad (281,458 age rows). Missing values are retained. Personal IDs excluded from download.
Download trip CSV ↗ORIGINAL POWER BI · DOCUMENTED WORK
The original dashboard, unretouched
Data Analytics course project at Coderhouse, exploring Ecobici trips and cycling mobility in Buenos Aires. Some Power BI Desktop map visuals were disabled in the original captures.
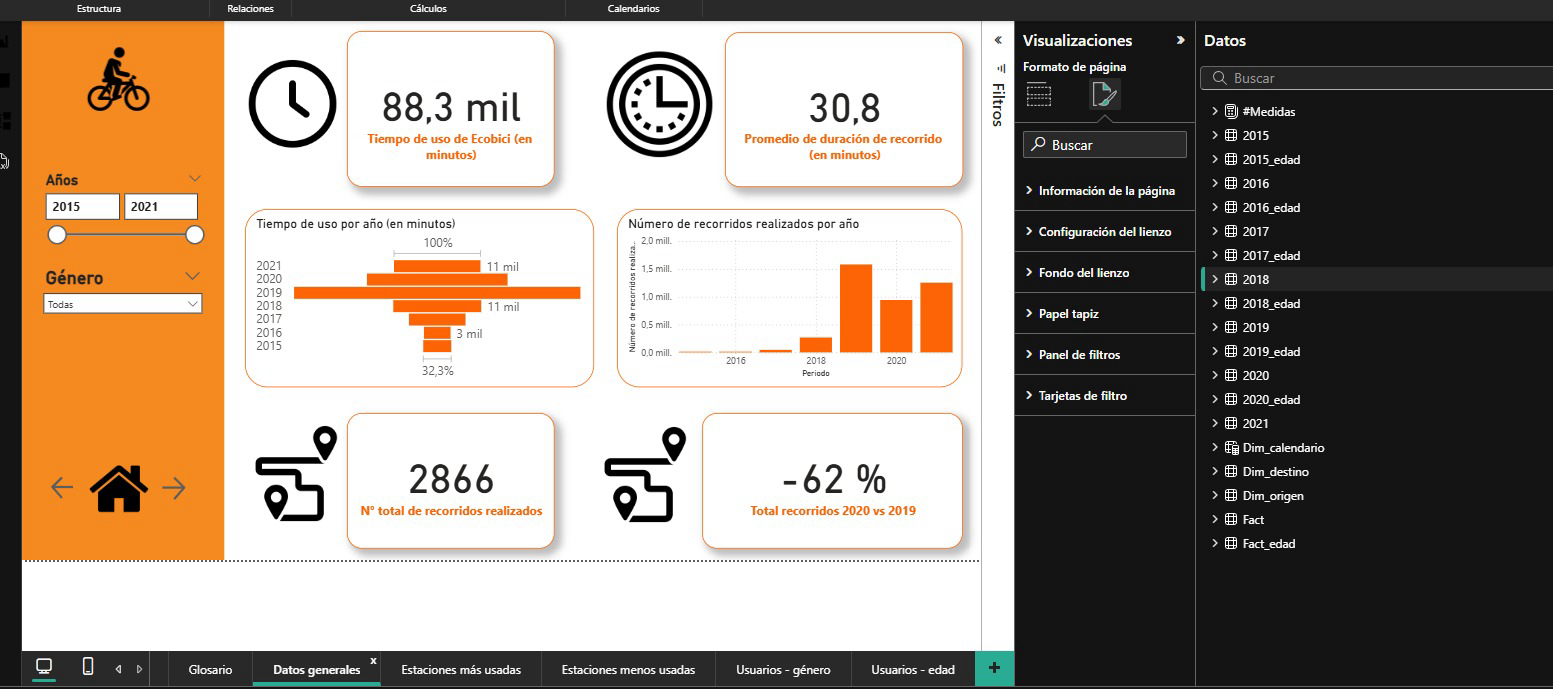
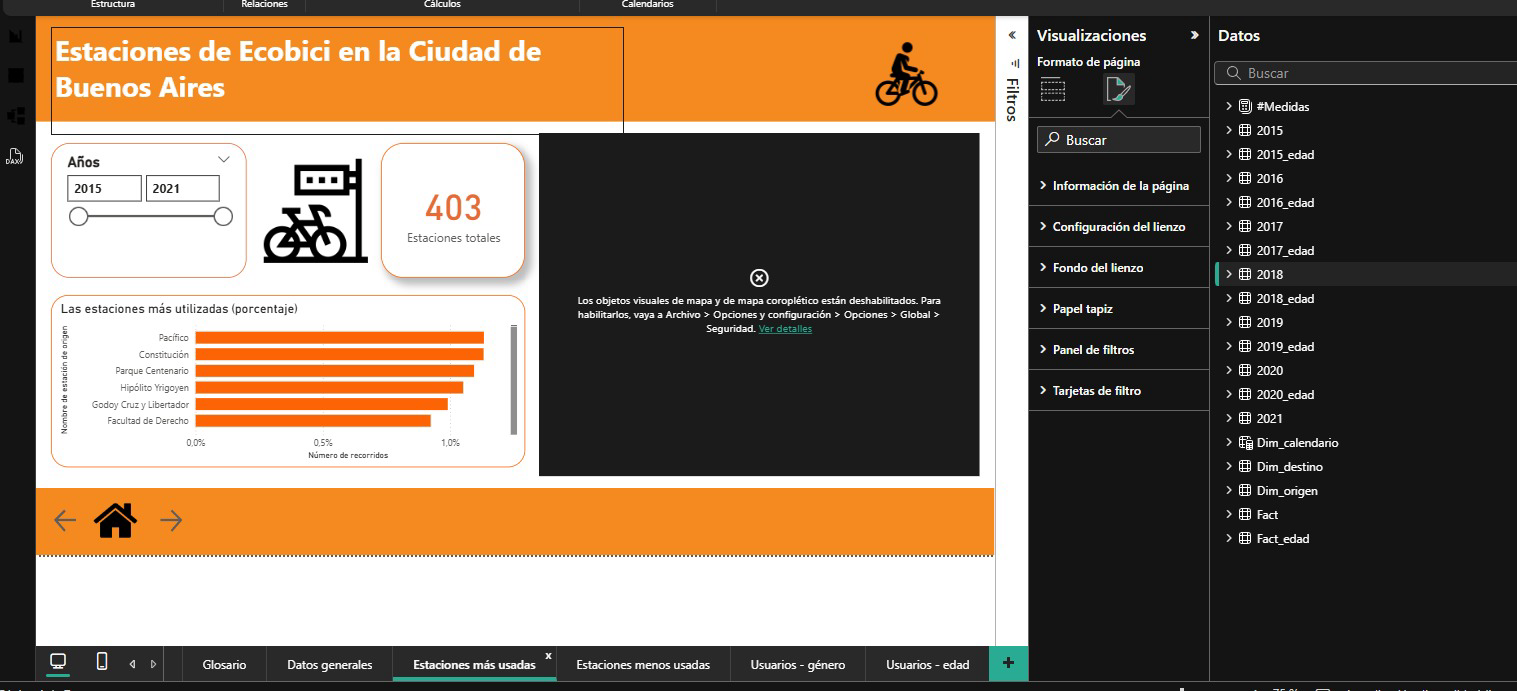
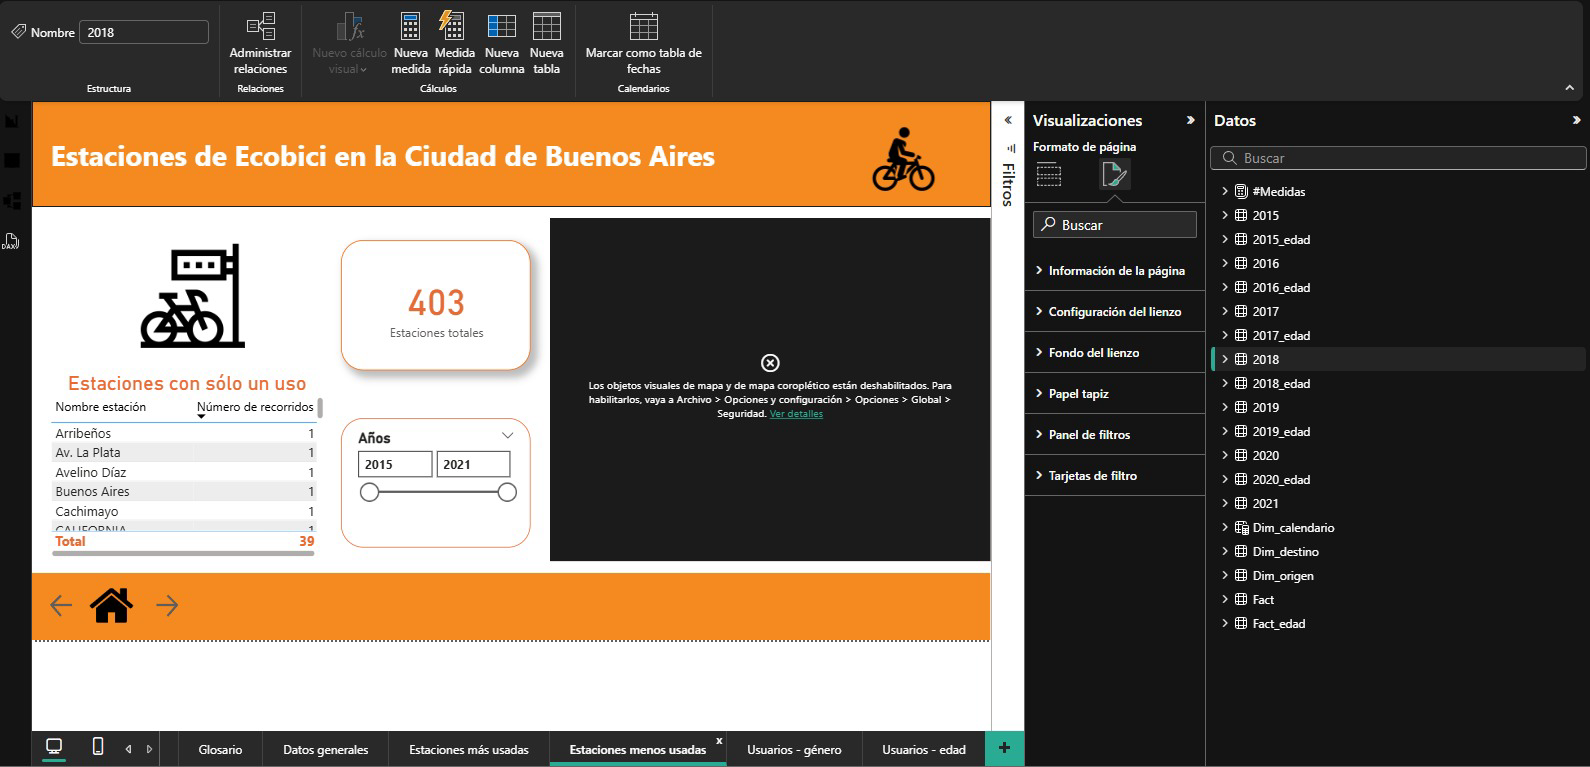
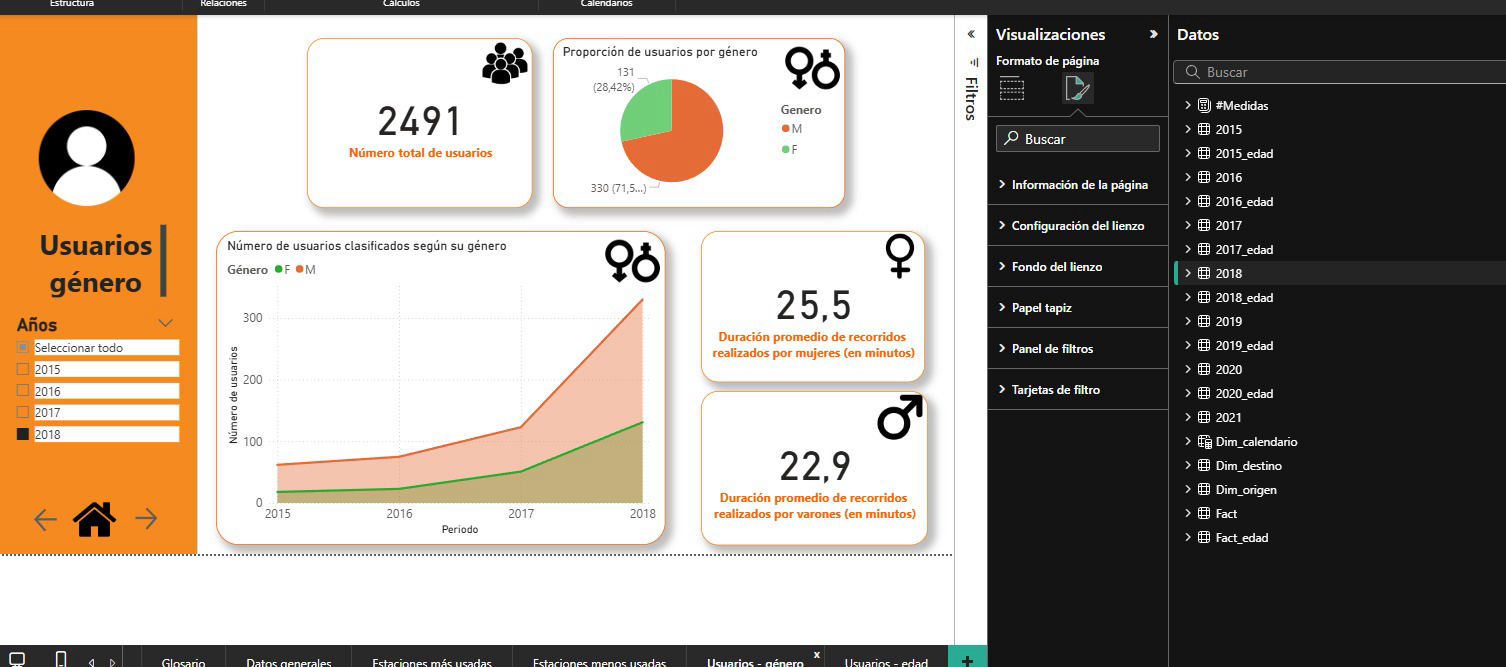
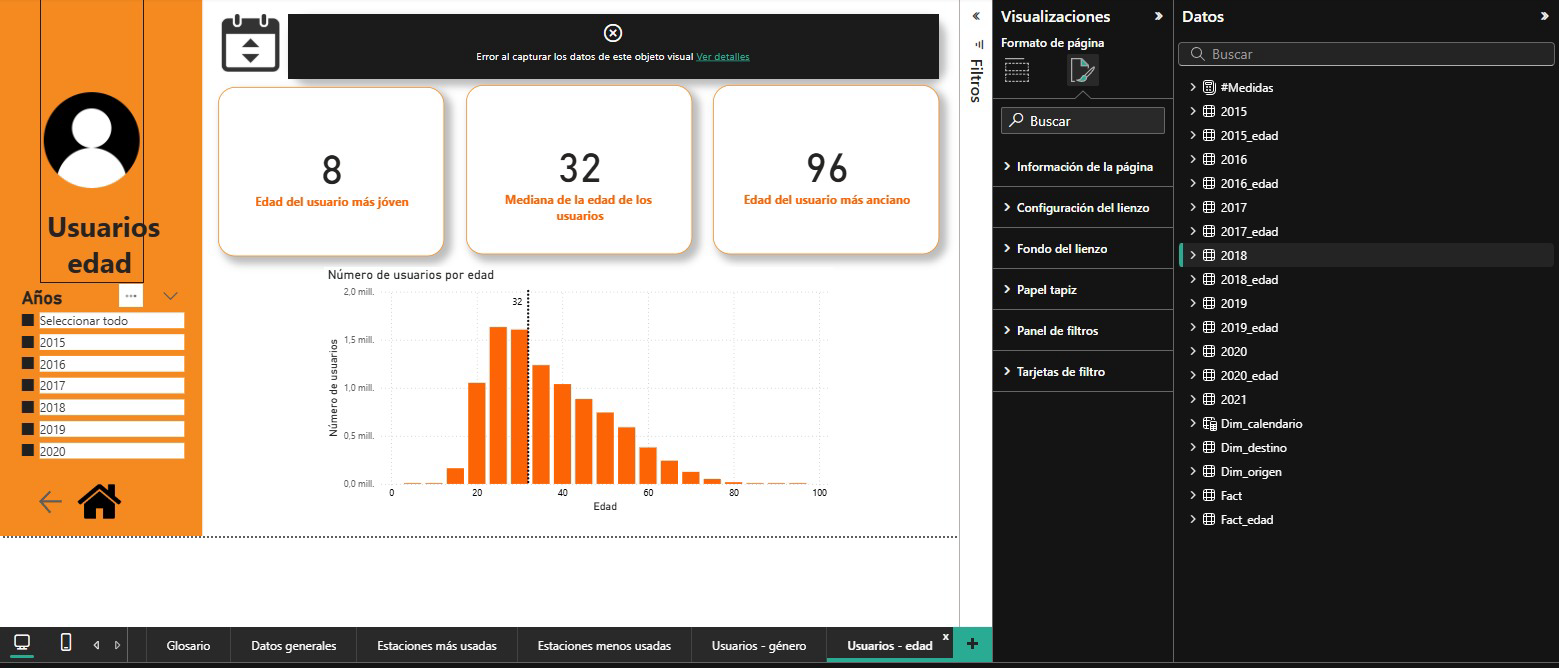
Original Power BI Desktop screenshots · Historical project; figures depend on original filters and period.
01 — The project
Make information more useful.
This project is preserved as a Power BI (.pbix) file in my repository. It includes screenshots from the original dashboard and an interactive reconstruction using 2,866 trip records from 2015–2021 and a separate age table recovered from the original model.
02 — The challenge
From data to a reading experience
A dashboard is more than a collection of charts: it needs a clear path, visual priorities and context to interpret what it shows.
03 — Making data understandable
A structure to explore.
The original deliverable and the new interactive exploration are presented separately, with explicit data sources and limitations.
Understand the variables and purpose of the analysis.
Organize metrics and groups for exploration.
Create a consistent visual hierarchy for charts and metrics.
Review readability, filters and the questions the dashboard can answer.
04 — Next iteration
This case study will keep growing.
Original dashboard screenshots are documented. A later export recovered Fact and the main dimensions. Missing values and independent age counts are explicitly distinguished.