POWER BI · DATA VISUALIZATION · PORTFOLIO PROJECT
Netflix · Be Data
Exploring data with Power BI: organizing information to make patterns easier to spot.
CONCEPT COVER · NOT THE ORIGINAL DASHBOARD
INTERACTIVE EXPLORATION · 2026 REBUILD
IMDB SAMPLE EXPLORER · DATASET HISTÓRICO
20,028 films to explore.
This visualization uses the recovered original project spreadsheet. It is a historical IMDb movie sample (1912–2020), NOT a list of titles currently streaming on Netflix.
Loading the original dataset…
Source: IMDb export supplied from the original project. Each film is counted by its recorded primary genre and country; missing data and sampling biases have not been fully audited.
Download CSV for Tableau ↗ORIGINAL POWER BI · DOCUMENTED WORK
The original dashboard, unretouched
Be Data group project based on an IMDb sample, not Netflix’s official catalogue. By María Soledad Sorzio, Verónica Acosta and Yohana Baldoma.
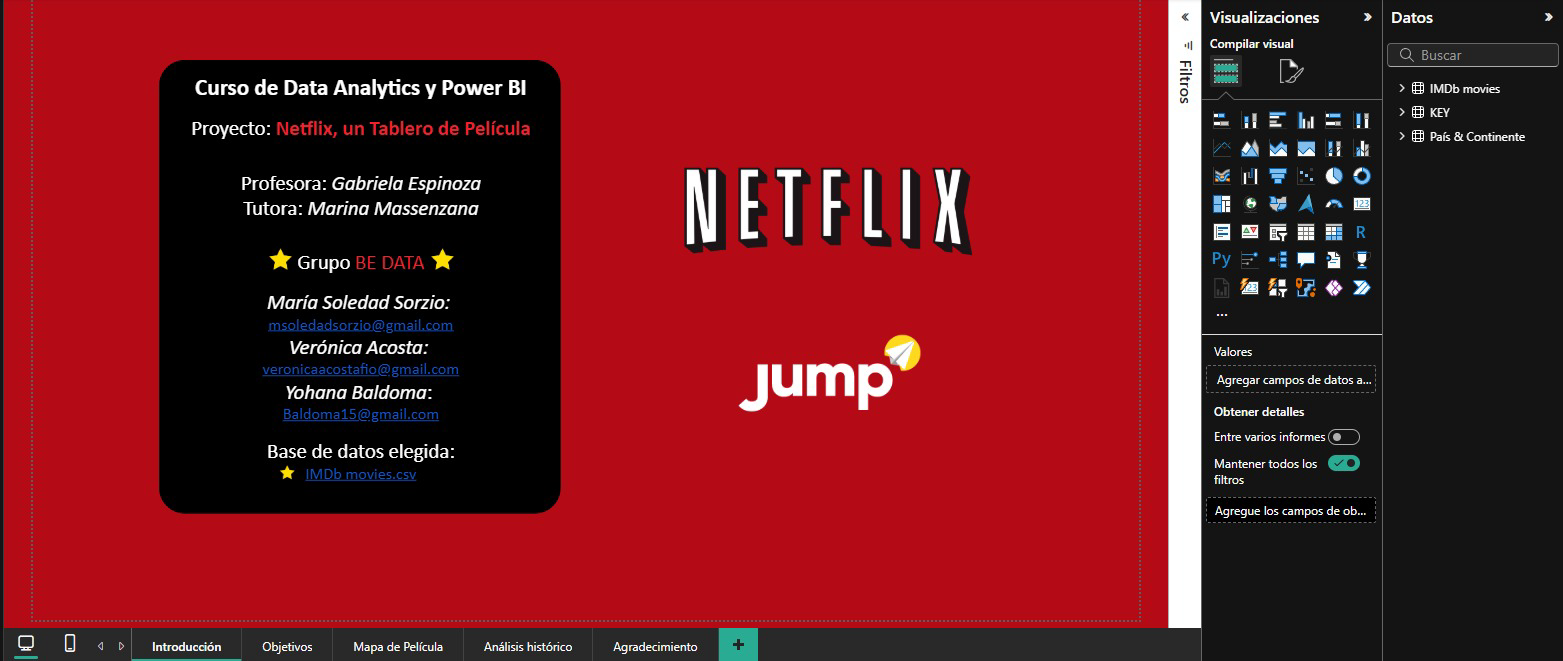
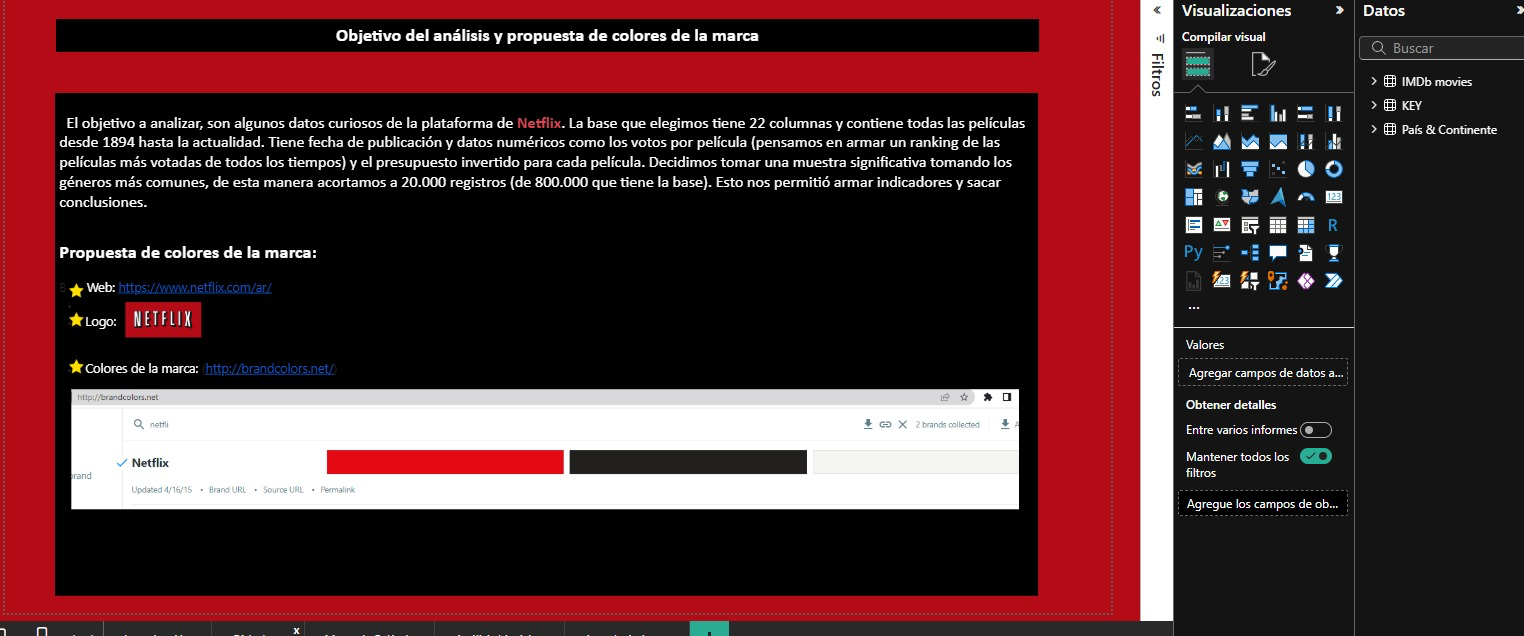
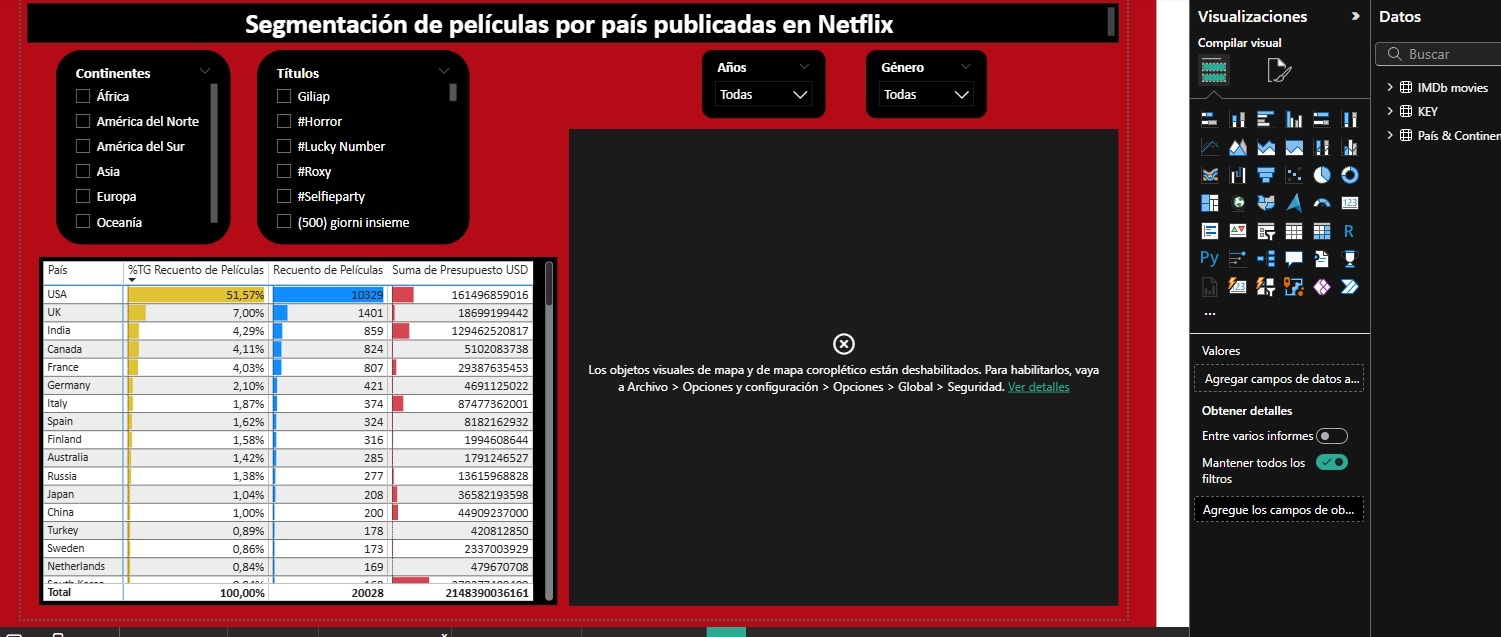
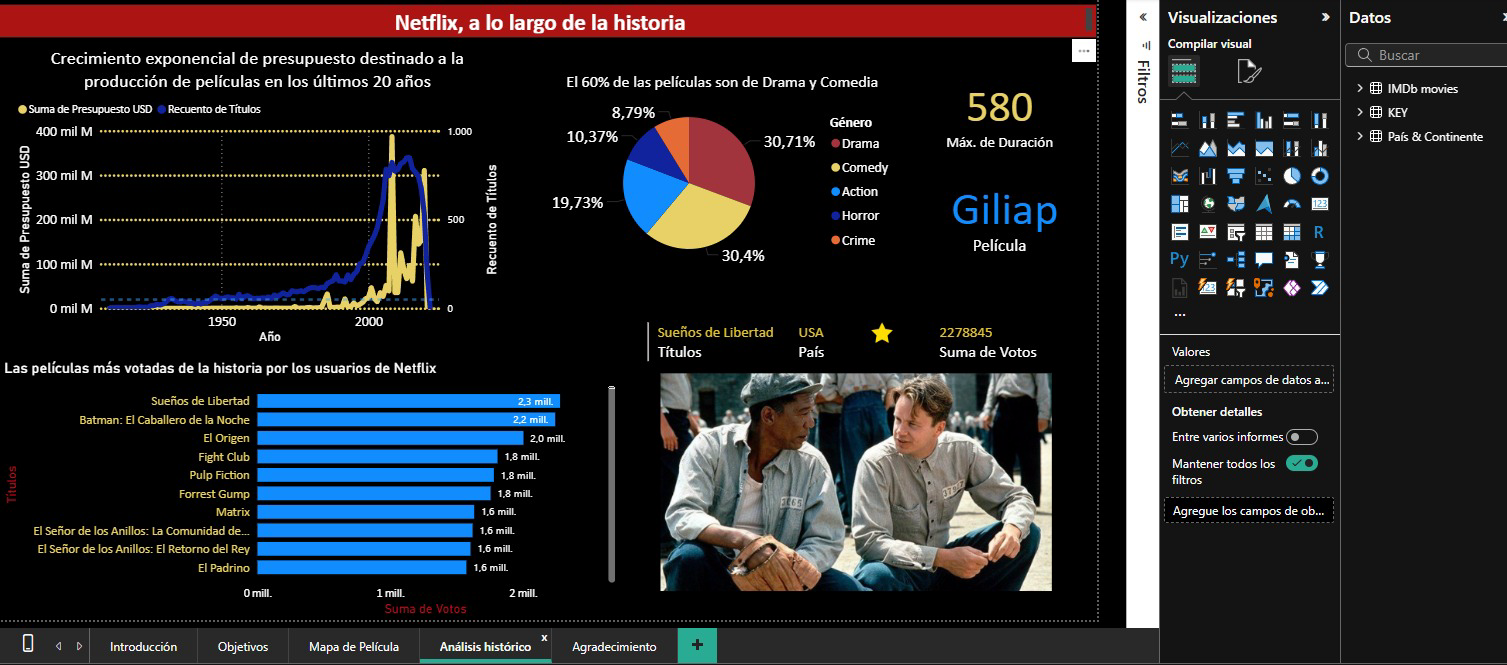
Original Power BI Desktop screenshots · Historical project; figures depend on original filters and period.
01 — The project
Make information more useful.
The original dashboard is available as a .pbix file on GitHub, titled ‘Tablero de Netflix by Be Data’. This version includes original screenshots and an interactive exploration of the 20,028-film exported IMDb sample, which is not an official Netflix catalogue.
02 — The challenge
Turn information into a visual story
Good analysis communicates what to look at first, how to compare and which questions emerge when exploring the content.
03 — Making data understandable
A structure to explore.
The original deliverable and the new interactive exploration are presented separately, with explicit data sources and limitations.
Define the focus and analytical questions.
Choose charts suited to the comparisons.
Work on contrast, grouping and clear labeling.
Create a path from overview to details.
04 — Next iteration
This case study will keep growing.
The IMDb sample now supports genre, country and period analysis. The new exploration is separate from the original group deliverable.